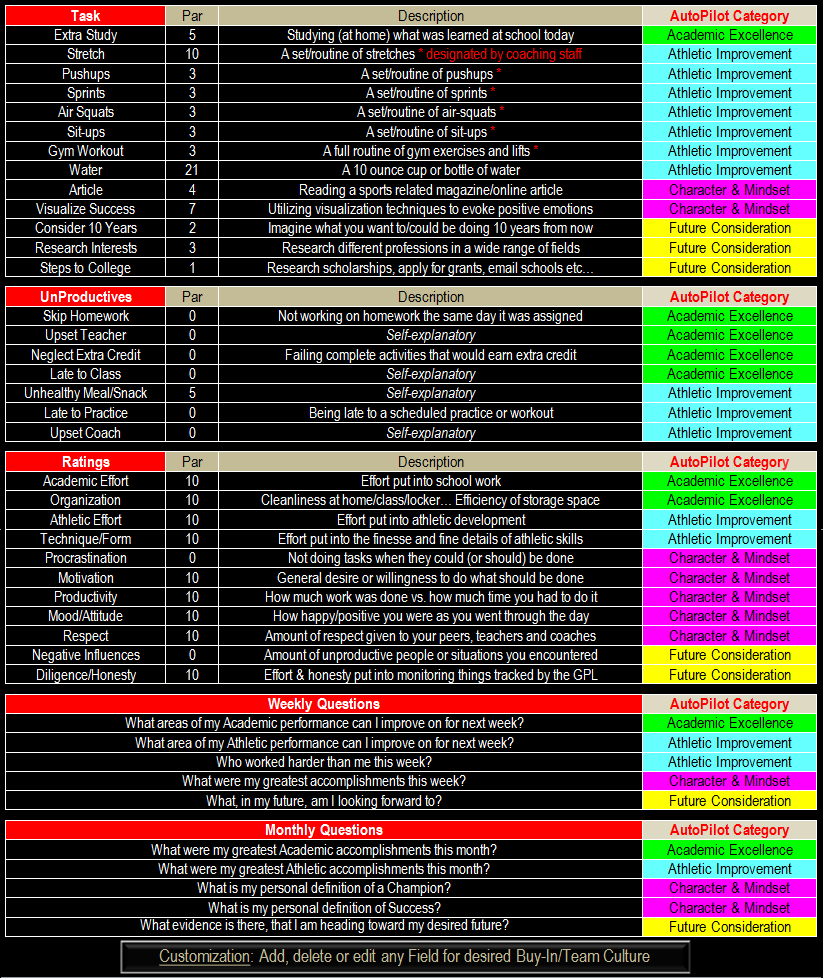
Here is the Fields that will be tracked (via the Goal Progression Log) during the AutoPilot program
© 2014 RosterRecharge LLC. All Rights Reserved
Productivity
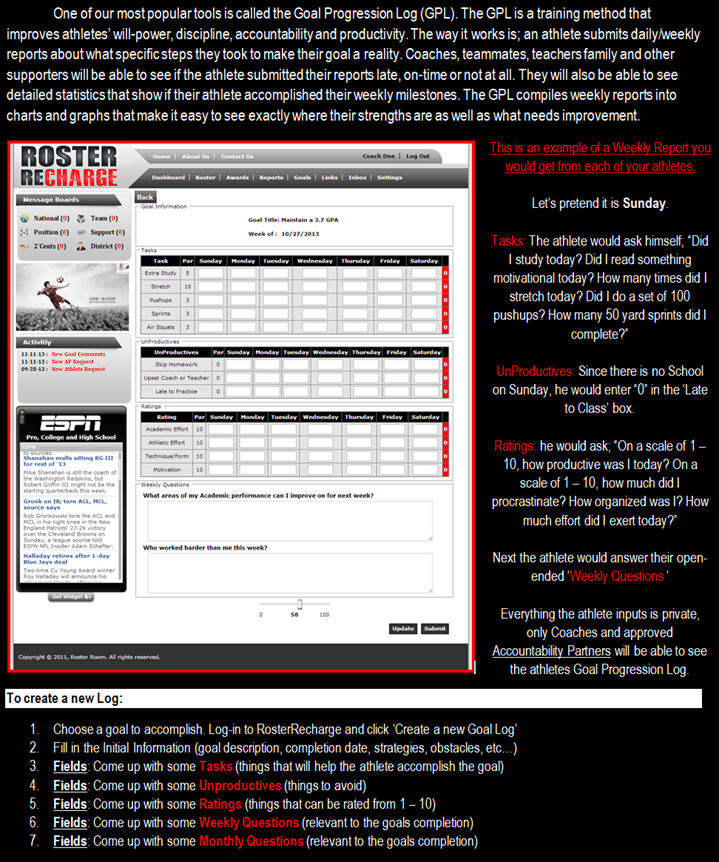
The Goal Progression Log
Metrics Graphs
and Charts
and Charts
Organization Dashboard
Productivity


© 2014 RosterRecharge LLC. All Rights Reserved


© 2014 RosterRecharge LLC. All Rights Reserved

The New Roster View
See the status of your team in a glance
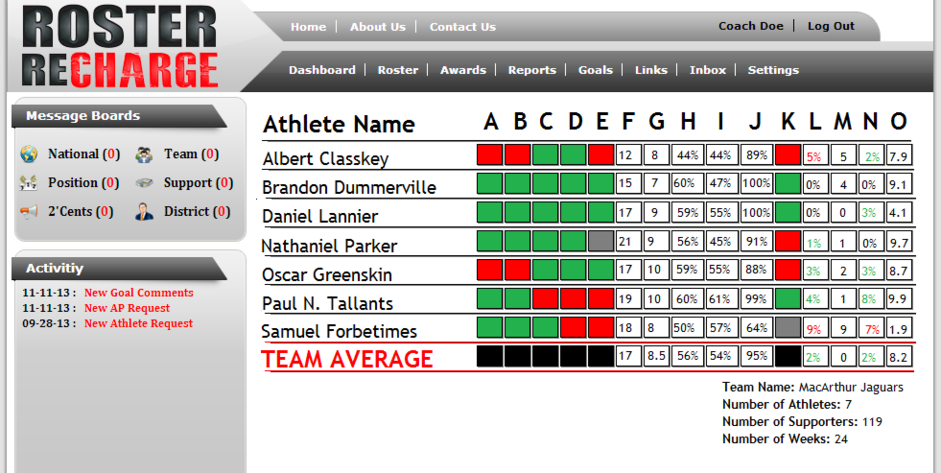
Column A: If Assignment 1 is completed on time (day 1) this box will be green. If it is completed late, the box will be red. If it hasn’t been completed yet, the box will be gray.
Column B: If Assignment 2 is completed on time (day 2) this box will be green. If it is completed late, the box will be red. If it hasn’t been completed yet, the box will be gray.
Column C: If Assignment 3 is completed on time (day 3) this box will be green. If it is completed late, the box will be red. If it hasn’t been completed yet, the box will be gray.
Column D: If Assignment 4 is completed on time (day 4) this box will be green. If it is completed late, the box will be red. If it hasn’t been completed yet, the box will be gray.
Column E: If Assignment 5 is completed on time (by day 7) this box will be green. If it is completed late, the box will be red. If it hasn’t been completed yet, the box will be gray.
Column F: Supporters - This is the number of non-athlete Accountability Partners the athlete has.
Column G: Teammate APs - This is the number of teammate Accountability Partners the athlete has.
Column H: Goal Completion Percentage (based on date) - Each goal has a start date and an end date. This percentage will increase in relation to when the goal is expected to be completed.
Column I: Goal Completion Percentage (based on input) - Each week, the athlete will be asked how much closer to their goal they think they are. This percent will increase accordingly.
Column J: Percent of On Time Submissions - Each week the athlete submits a Weekly Report. This percentage shows how many of those reports were submitted on time.
Column K: Last Week’s Submission Status - If last week’s Weekly Report was submitted on time, this box will be green. If it was late, the box will be red. If it has not been submitted yet, the box will be gray.
Column L: Difference in Tasks Par - Each Task has a “Par” or “number of times the task should be completed.” The percent in this column represents the difference between the week’s Par and what actually happened. For example: An athlete’s weekly Par for ‘Stretches’ is 20. If the athlete stretched 19 times then the difference is 1 (5%). Because the difference is negative (below Par), you would see a RED “5%” to indicate that the Par was underachieved by 5%.
Column M: Difference in UnProductives Par - Each UnProductive has a “Par” or “least number of times the UnProductive should occur” – most of the time this number will be 0. The number in this column represents the difference between the week’s Par and what actually happened.
Column N: Difference in Ratings Par - The percent in this column represents the difference between the week’s Par and what actually was recorded.
Column O: Collaboration and Teamwork - This number shows the number of Accountability Partners the athlete interacted with last week. Interactions are; goal comments, EVALs and/or wall posts.
Access your account from any computer, smartphone or tablet – no downloads needed.

Since 1985 Gatorade Player of the Year awards have been given based on Athletic Achievement, Academic Excellence and Exemplary Character.
These are a near match with three of the AutoPilot Categories;
Athletic Improvement, Academic Excellence, and Character & Mindset.
These are a near match with three of the AutoPilot Categories;
Athletic Improvement, Academic Excellence, and Character & Mindset.
You can decide which Fields (Tasks, UnProductives, Ratings, Weekly Questions and Monthly Questions) your athletes track. Come up with your own Fields and add, edit or delete any of the suggested Fields from the list above.
Click the button below to see examples of how you can tailor your teams Fields to fit whatever goals you are trying to accomplish.
Click the button below to see examples of how you can tailor your teams Fields to fit whatever goals you are trying to accomplish.
Complete Customization